Advanced Therapy Medicinal Products are promising drugs for patients in therapeutic impasses. Their complex fabrication process implies regular quality controls to monitor cell concentration. Among the different methods available, optical techniques offer several advantages. Our study aims to measure cell concentration in real time in a potential closed-loop environment using white light spectroscopy and to test the possibility of simultaneously measuring concentrations of several species. By analyzing the shapes of the absorption spectra, this system allowed the quantification of T-cells with an accuracy of about 3% during 30 h of cultivation monitoring and 26 h of doubling time, coherent with what is expected for normal cell culture. Moreover, our system permitted concentration measurements for two species in reconstructed co-cultures of T-cells and Candida albicans yeasts. This method can now be applied to any single or co-culture, it allows real-time monitoring, and can be easily integrated into a closed system.
1. Introduction
1.1. Context
Advanced Therapy Medicinal Products (ATMPs) are drugs based on genes, tissues, or cells for human use for the treatment of chronic, degenerative, or life-threatening diseases [1]. Genetic modification or tissue engineering give them new physiological, biological characteristics, or reconstruction properties. However, complex and expensive technologies of cell sorting, amplification, genetic transduction, and activation are required to produce these drugs. The whole process takes place in a controlled environment and numerous quality controls are performed throughout the production for up to 10 days. Consequently, the price of these promising therapeutic products restricts the possibility to democratize their use for the greatest number of people. Devices developed during the last few years are not optimal because they do not include/allow online tracking technologies. Only a few parameters such as temperature, pH, or dissolved O2 are monitored using sterile probes placed inside the bioreactor. The PAT project (Process Analytical Technology) was born from this observation by the FDA in 2004. This project encourages research and development of new analysis technologies allowing real-time monitoring of all production stages of biopharmaceutical drugs. Concerning ATMPs, the whole production process is quite complex [2], and the above-mentioned quality controls are frequently performed, especially during the expansion phase [3,4]. Multiplying these controls, and therefore samplings, increases the risk of new contaminations.
Therefore, there are two needs: (i) to develop monitoring solutions easily transferable in a closed-loop system for real-time cell concentration measurements without sampling bioreactor content, and (ii) to monitor simultaneously concentrations of several species during their growth and to follow the development of possible contaminations and more generally to monitor co-cultures.
1.2. Commercial Availabilities for Cell Counting
Cell concentration has been historically determined by direct measurement of cell number under microscopes through Malassez cells. This most well-known technique is still used with drawbacks of difficulties for visual and manual counting and poor reproducibility due to the relatively small cell volumes sampled and therefore less representative of the culture flask. Alternative and commercial automated methods are now available to facilitate cell counting. Automatic cell counters are commercially available. The LUNATM system (LOGOS BIOSYSTEMS; [5,6,7]) requires 10 µL of cell suspension and is based on conventional imaging and processing. Other systems developed by IPRASENSE are based on lensless imaging [8] in which cell diffraction figures on a large area are recorded and analyzed to assess cell concentration at a higher accuracy; among them, NORMA uses 10 µL, whereas CYTONOTE is preferred for measurement of adherent cells on larger volumes. In addition, INCUCYTE® (SARTORIUS) used for both adherent and non-adherent cells [9,10] and the HoloMonitor® system (PHI [11]) are in situ microscopy systems based on holographic imaging placed within an incubator. It allows for cell counting directly within different volumes including 96 well plates for high throughputs and/or multiple simultaneous experiments.
Despite their easy use, these commercial systems seem difficult to be integrated into a closed-loop and real-time environment.
1.3. Other Biological and Physical Techniques for Cell Qualifications
Other methods can also be used for both cell and subcellular entity qualifications. Some are based on the capture of the biological entity on the biosensor surface by a ligand–analyte reaction such as an enzyme-linked immunosorbent assay (ELISA) [12,13], Surface Plasmon Resonance [14,15], and Quartz Crystal Microbalances [16,17]. However, these methods require a biological interface and a regular regeneration of the surface, which makes transposition to a real-time measurement system difficult. Other methods can be used without a bio-chemical interface. Among them, impedance spectroscopy (or dielectric spectroscopy) has been widely used to study cell culture processes, particularly in the monitoring of mammalian cells [18]. This technique allows cell quantification thanks to their polarization after the application of an alternating electric field and presents several advantages such as in situ analysis of cell culture and rapid measurements. However, this method requires calibration, and the accuracy decreases during the stationary phase of growth [19]. Different spectroscopic methods have been applied for the characterization of mammalian cell culture [20]. Among them, Raman spectroscopy performed either in situ [21] and/or through surface-enhanced Raman scattering [22,23] has already been used for biological purposes [24] during quality controls carried out on cell culture [23] and for pathogen detection [25]. However, the fine and precise data obtained by these techniques may not be required for cell monitoring. Flow cytometry can also be employed for cell counting [26,27] and activation detection [28]. Depending on the optical detection scheme, counting and assessing biological properties for quality control could be performed simultaneously. It is also the case for most of the techniques described above that also allow for simultaneous detection of different species in co-cultivation but could require additional sample treatments such as fluorescence labeling [29].
Indeed, cell counting methods described above all imply considering cells one by one to assess cell concentrations and most require sampling of small volumes poorly representative of what occurs in the bioreactor. Concerning co-culture studies, label-free techniques should be preferred.
1.4. Global Methods and Co-Culture Investigations
Measurements without sampling are possible either by derivation or using sterilized optical probes as proposed in [3,4]. Such methods concern the global “light-culture” interaction rather than the behavior of individual particles. Absorption-based methods like turbidimetry or Beer–Lambert law derived techniques have usually been used and preferred for smaller biological entities such as bacteria but can also be applied to mammalian cells [30]. These techniques could also be performed in larger volumes [3,31,32,33,34] to determine cell density and viability [35].
Methods of concentration determination relying on the estimation of only one parameter (Beer–Lambert derived methods or cell counters) cannot be used to simultaneously monitor concentrations of several species. For this, a multi-parameters method should be employed. The detection of several species has already been reported but remains a challenge. Non-optical methods such as quartz crystal sensors [36] or electrochemistry [37] have recently been used either for bacteria detection in complex fluids or multiple bacteria detection. White light spectroscopy and light scattering analysis have already been used for the detection of bacteria in co-culture [38,39]. We previously determined B-cell concentration using white light spectroscopy and its use to detect contaminations [3,4]. The use of fiber optic Fourier Transform Infra-Red spectroscopy has also been reported [40]. Only a few papers mention both cell monitoring and contaminant detection; in particular, advanced signal processing applied to Raman spectroscopy has been proposed [41]. Together with normal operation condition monitoring, the authors demonstrated the detection of growth perturbations 5 h after the discontinuation of cell feeding and detected the effects of contamination with their monitoring algorithm. However, the nature of the contamination and the time required to detect it were not specified.
1.5. Current Needs and Proposed Method
To summarize, there are needs for an online and sampling-free cell concentration monitoring device, and for methods allowing simultaneous concentration measurements for several species. Because they are contactless, optical techniques are good candidates to meet these needs. Since each biological species exhibits its absorption spectrum, optical spectroscopy should allow for discriminating spectral signatures of species during co-culture.
In this paper, white light spectroscopy was used to measure T-cell concentrations from the shape of the absorption spectra of different dilutions. Indeed, measuring concentrations from the spectral value at only one wavelength (Beer–Lambert derived methods) we proposed [30] cannot be used to measure concentrations of several species simultaneously. Indeed, the shape of the whole absorption spectrum of a mixture is a combination of the shapes of each individual species. Therefore, mathematical treatment of the mixture spectrum allows the measurement of concentrations of individual species simultaneously. The paper is structured as follows: Section 2 presents the materials and methods used in this study. Numerical and experimental results concerning the spectral shape analysis and the possibility to extend this method in the case of two simultaneous concentration measurements are the subject of Section 3. Results will then be discussed (Section 4), and conclusions presented (Section 5).
2. Materials and Methods
2.1. CEM Preparation
CEM cells (ATCC® CRL-2265TM) are T lymphoblasts that were supplied by the French Blood Agency (EFS Etablissement Français du Sang). They were grown in RPMI-1640 medium (P04-16515, PAN-Biotech®, Germany) supplemented with 25 mM HEPES (P05-01500, PAN Biotech®, Germany), 10% heat-inactivated FBS (10270 -106, Fischer Scientific®, France), and 1% penicillin (10 kU/mL−1)/streptomycin (10 mg.mL−1) (FG101-01, TransGen Biotech®, China). The cells were maintained at 37 °C in a humidified atmosphere containing 5% CO2.
Different concentrations were prepared by diluting cuvettes in RPMI medium to obtain concentrations between 105 and 106 cells.mL−1. To generate a robust spectroscopy model, a large number of different spectra is required (i.e., a large number of associated concentrations). Since each spectroscopy measurement required 2.5 mL of cell solution, 8 weeks of cell culture were necessary. Each week, diluted cuvettes of 8 different concentrations distributed between 105 to 106 cells.mL−1 were prepared resulting in 80 experimental data. Three cell counts (using the LUNA-II Automated Cell Counter, Logos Biosystems®, South Korea, supplier France, with trypan blue V/V, 15,250,061 Fisher Scientific®, France, with 10 µL of cell suspension) and one spectral measurement were performed with each cuvette for mathematical modeling purposes.
2.2. Cultivation of CEM Cells over 30 Hours
Three days post passage CEM cells were centrifugated at 500× g for 10 min at room temperature. The pellet was resuspended at a concentration of 5 × 10⁵ cells.mL−1. They were maintained at 37 °C for 30 h. Spectral measurements were performed every hour for the first 4 h, every 30 min from T = 4 to T = 11 h, and every 2 h between T = 21 and T = 30 h.
2.3. Concentration Ranges for Optical Absorption Modeling of Candida Albicans
The Candida albicans yeast strains (ATCC10231) were grown on SAB plates (PO5001A, OXOID, France) prior to liquid culture in SAB (TV5054E, Oxoid, France) aerobically at 22.5 °C at 200 rpm for 2 days. They were recovered by two centrifugations at 10,000× g, 10 min, 20 °C, and resuspended in PBS 1x pH7.4 (Sigma, USA). The optical density of the re-suspension was measured in a spectrophotometer at 600 nm (BIOWAVE DNA, BIOCHROM, United Kingdom). Afterwards, different yeast concentrations from 0.5 × 10⁶ to 4 × 10⁶ cells.mL−1 were prepared for experiments and analysis.
2.4. Spectroscopic Absorption Measurements
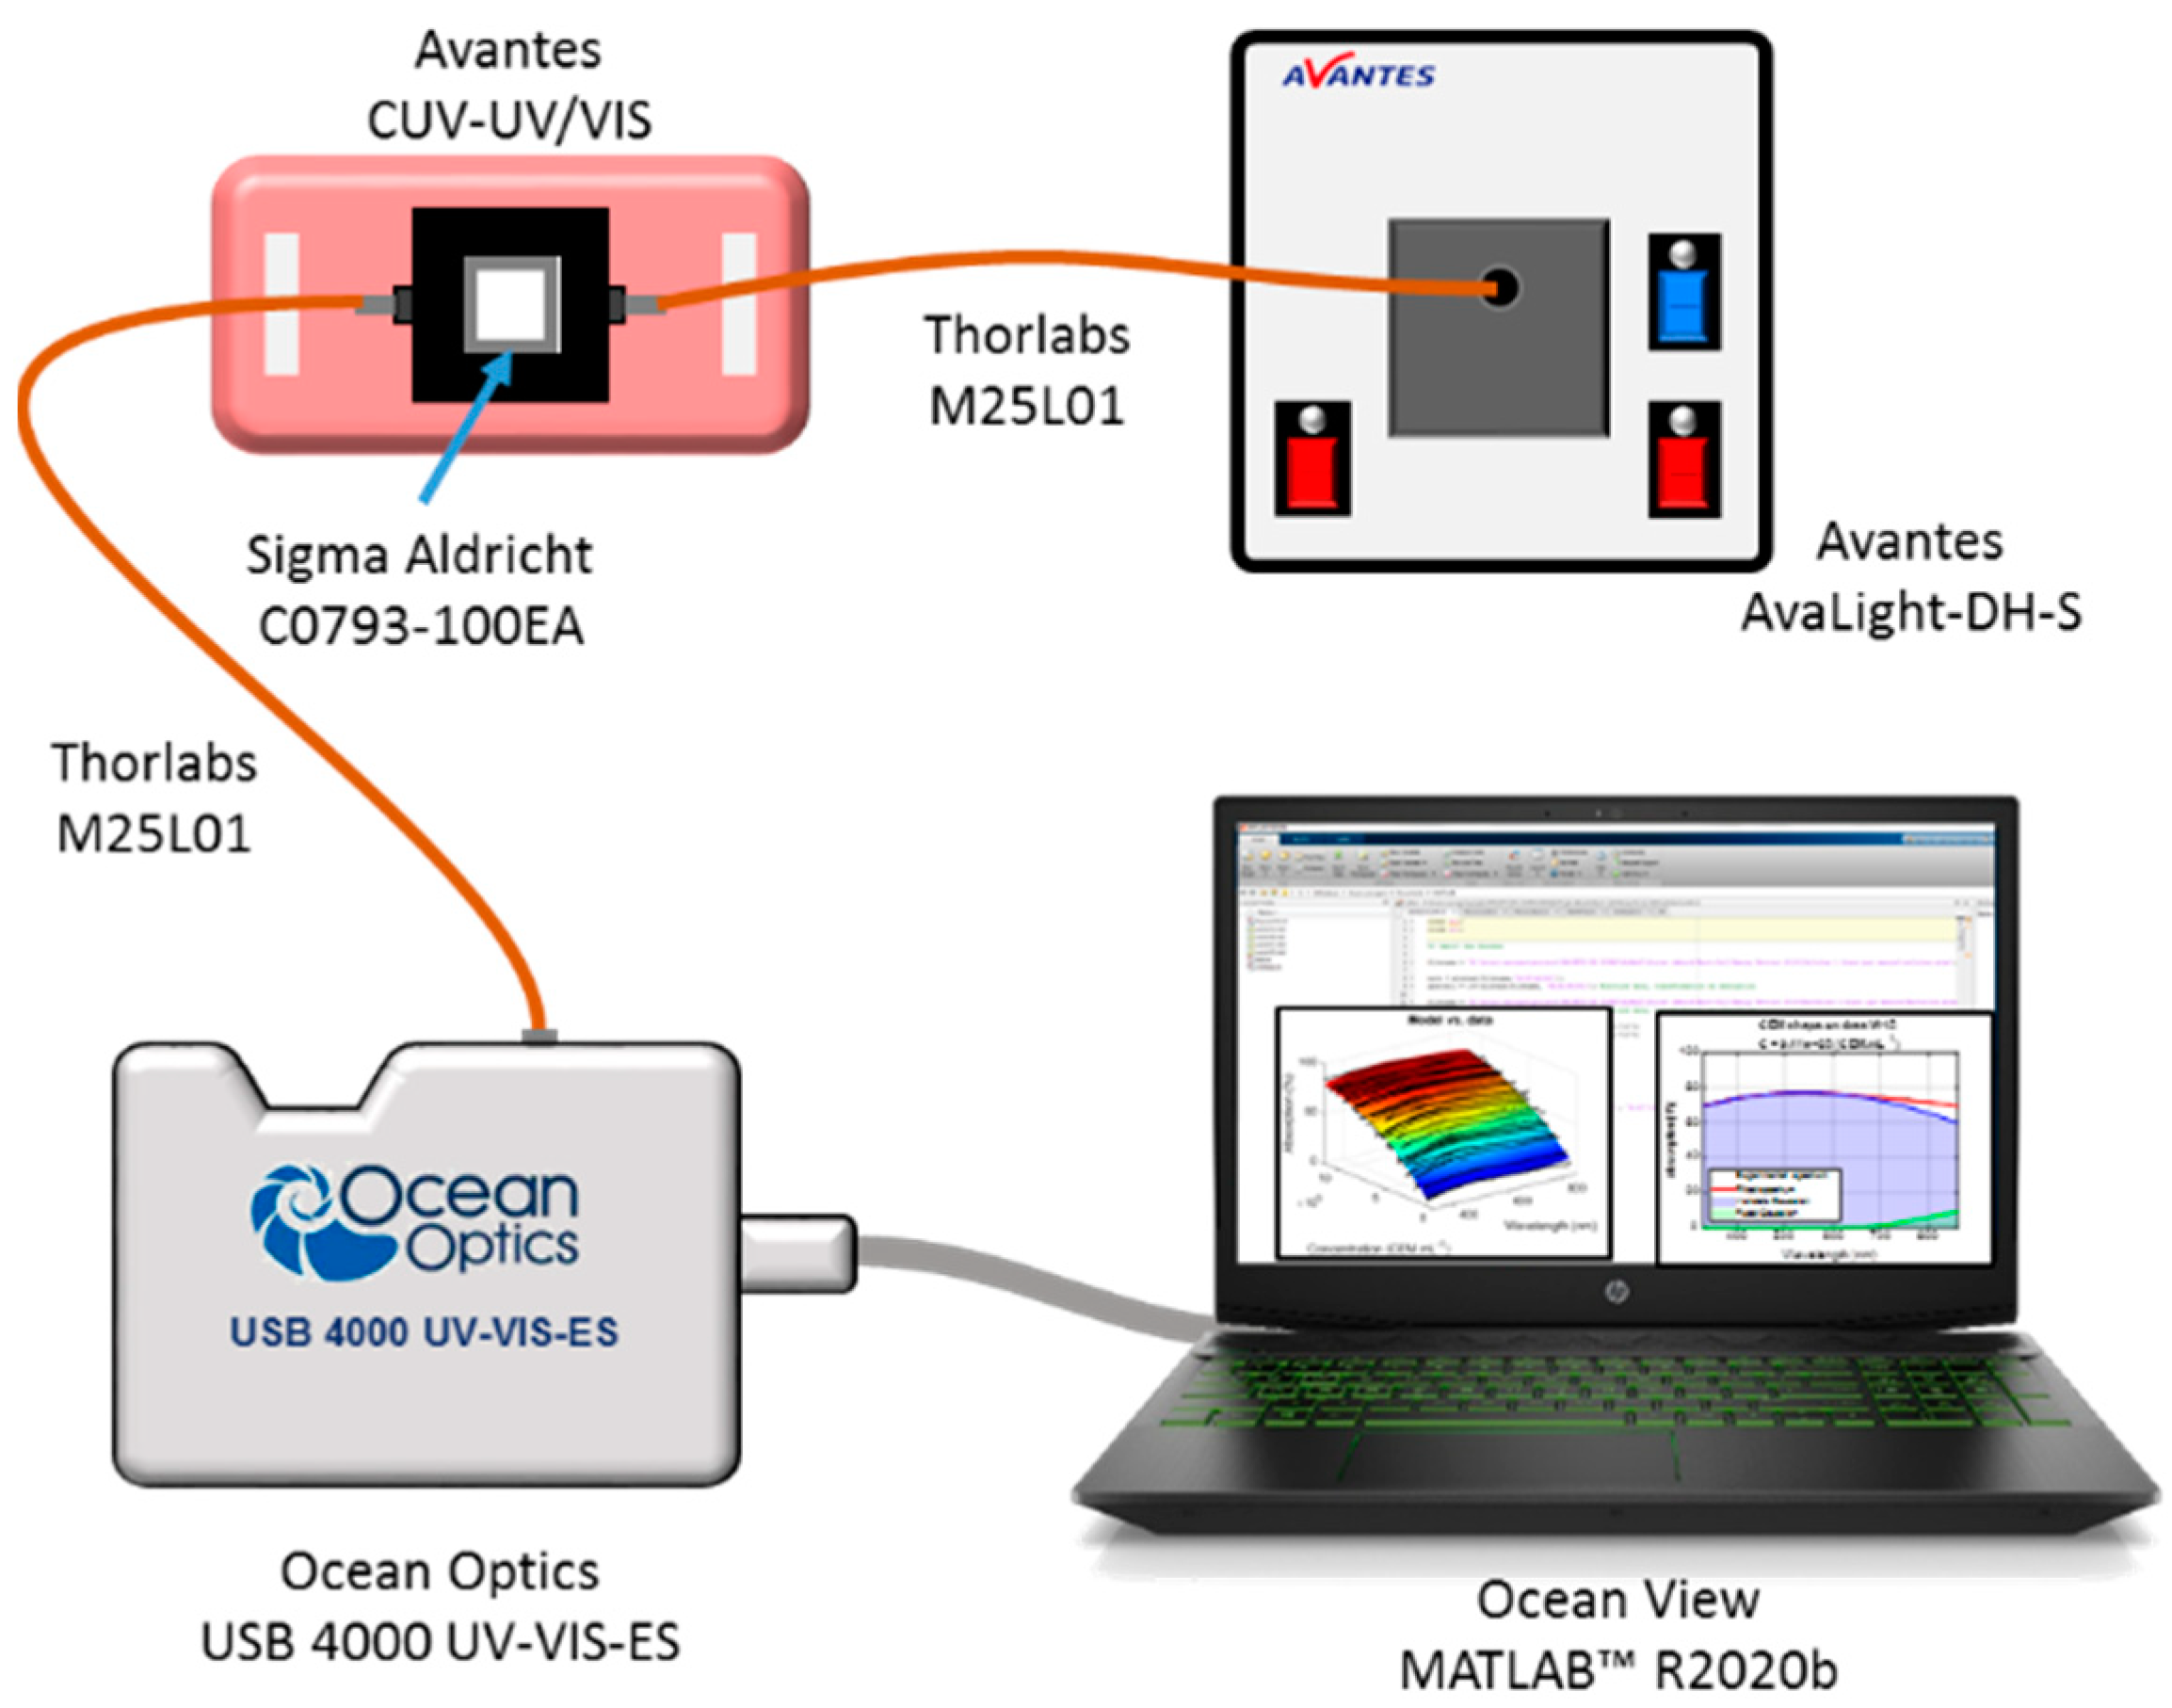
Spectral absorption measurements of CEM suspensions were performed using the experimental setup shown in Figure 1 (adapted from [30]). The spectroscopy measuring system consists of a light source (AvaLight-DH-S-BAL, Avantes®, the Netherlands, supplier France) connected by optical fibers (Thorlabs, USA, supplier France, M25L01) to a cuvette holder (Avantes, the Netherlands, supplier France, CUV-UV/VIS). The white light source was switched on about 30 min before measurements to allow temperature and spectral characteristics’ stabilization. After propagation through the cuvette, the light was transmitted to the spectrophotometer (Ocean Optics, USA, supplier France, USB 4000 UV-VIS-ES) for spectra acquisition. Before each measurement, a reference spectrum was acquired using a cuvette containing RPMI medium. Suspensions were homogenized by several gentle inversions before each spectroscopy measurement. Spectra were recorded in transmission, in the wavelength range between 177 nm and 892 nm with a step of 0.22 nm using the OceanView (Ocean Insight, USA, supplier France,) software.